Improving Vulkan Breakout
There are lots of reasons why I love the internet, but one of the big ones is that it gives me a way to learn from folks that I would never get to interact with in real life.
Two weeks ago I posted about Comparing Uniform Data Transfer Methods In Vulkan, and immediately got a bunch of great suggestions from Twitter (thanks @SaschaWillems2!), and from reddit on how I could improve things. There was enough there that I thought it warranted revisiting my Breakout clone to test out some new ideas.
 Me irl
The main pieces of feedback were:
- vkCmdWriteTimestamp could be used to get more fine grained timing data
- I really didn’t need to be using _aligned_malloc with my dynamic uniform buffer approach
- It might be faster to use device-local memory
- With the approaches that don’t use push-constants, it might be faster to re-use command buffers instead of creating them every frame
It all sounded like great advice to me, so I decided to try out each point listed above, to see if the conclusions drawn in the first post are still valid.
Starting from the top:
Use vkCmdWriteTimestamp
I loved this bit of feedback, because it gave me another tool to use to do performance testing! Especially because before hearing about this bit of the api, I had no idea how to profile the performance of a specific chunk of a command buffer.
vkCmdWriteTimestamp writes it’s timing data into a VkQuery object. VkQuery objects are stored in a VkQueryPool. So the first step to getting timing data from vulkan is to create one of those:
VkQueryPoolCreateInfo createInfo = {};
createInfo.sType = VK_STRUCTURE_TYPE_QUERY_POOL_CREATE_INFO;
createInfo.pNext = nullptr;
createInfo.queryType = VK_QUERY_TYPE_TIMESTAMP;
createInfo.queryCount = 2;

VkResult res = vkCreateQueryPool(device, &createInfo, nullptr, &queryPool);
assert(res == VK_SUCCESS);
Since I only want to time the part of the rendering pipeline that changes between each uniform data implementation, I only need to allocate 2 queries - one to store the timestamp immediately before the block I’m timing executes, and one to store the timestamp after it’s done.
With that done, all that’s left is to add the appropriate calls to the draw function:
//abbreviated code

vkBeginCommandBuffer(commandBuffer, &beginInfo);
vkCmdResetQueryPool(commandBuffer, queryPool, 0, 2);

//more set up code... (omitted for brevity)

//the block we want to time starts here
vkCmdWriteTimestamp(commandBuffer, VK_PIPELINE_STAGE_BOTTOM_OF_PIPE_BIT, queryPool, 0);

for (int i = 0; i < PRIM_COUNT; ++i)
{
    //per primitive logic that we want to time
}
vkCmdWriteTimestamp(commandBuffer, VK_PIPELINE_STAGE_BOTTOM_OF_PIPE_BIT, queryPool, 1);
As you may have noticed, vkCmdWriteTimestamp takes a pipeline stage as one of it’s arguments. This was unintuitive for me, but here’s what the docs say about it:
“vkCmdWriteTimestamp latches the value of the timer when all previous commands have completed executing as far as the specified pipeline stage, and writes the timestamp value to memory. When the timestamp value is written, the availability status of the query is set to available.”
What it seems like this means (correct me if I’m wrong, internet), is that if you pass VK_PIPELINE_STAGE_BOTTOM_OF_PIPE_BIT to this function, you get the timestamp of when all the commands submitted to the command buffer BEFORE you call vkCmdWriteTimestamp have completed executing, whereas if you pass, for instance VK_PIPELINE_STAGE_TOP_OF_PIPE_BIT, you’d get the timestamp of when the commands before the timestamp call started execution.
Assuming that’s the case, then in order to measure just the execution of our loop in the above example, both calls to vkCmdWriteTimestamp need to be passed the VK_PIPELINE_STAGE_BOTTOM_OF_PIPE_BIT to get just the timing info for the code between the two calls.
If you recall, the frame time of each approach was measured last week as the following:
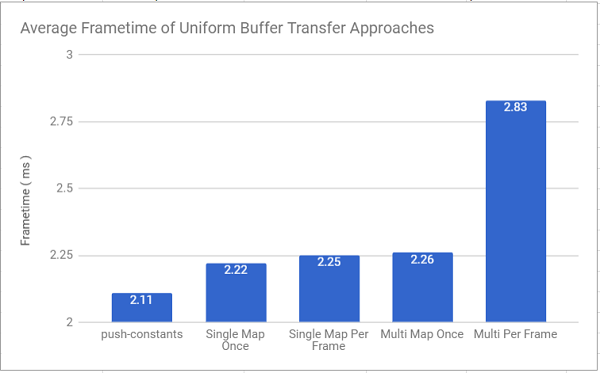
I re-ran this test, but this time used vkCmdWriteTimestamp to measure just the time it takes to add the primitives to the command queue and set up their uniform data:
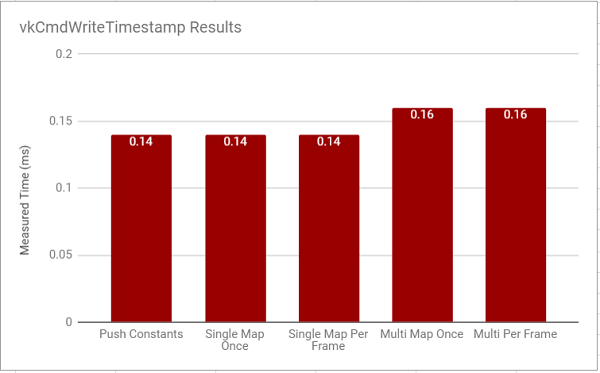
This data is likely of questionable usefulness because of how light the entire application is on the GPU, but it’s interesting nonetheless. It suggests that the push constant and single buffer approaches are equal in how fast they are to execute on the GPU. This might mean that the frametime difference between them was mostly due to the added time it took to memcpy data into the buffers for the single buffer approaches.
The multi-buffer approaches are slower than the others in this measure as well, which makes sense given that even when submitting to the command buffer, the multi-buffer branches have to change which buffers are bound all the time. However, because of how simple our frame is, all the approaches are almost exactly as fast. If the above timing code is accurate, it means that all the larger differences we’re seeing in the frametime of the application are due to the cost of memory mapping, and memcpying our uniform data around.
Don’t Use _aligned_malloc
The next piece of feedback came from reddit user rhynodegreat, and it is directly related to the cost of memory mapping we just talked about. It was pointed out that since I was using memcpy to transfer data to a mapped buffer pointer, I didn’t need to be using _aligned_malloc for the original allocation. I admit this was a bit of cargo culting on my end. I originally figured out how to use dynamic uniform buffers from some example code I found online, and didn’t question the use of _aligned_malloc, since I had never used it before.
Luckily, removing it from my code was as simple as replacing any calls to it with a simple malloc call.
uniformData = (PrimitiveUniformObject*)_aligned_malloc(bufferSize, dynamicAlignment);becomes
uniformData = (PrimitiveUniformObject*)malloc(bufferSize);Everything still works with the above changes, but I was curious as to whether it had any performance implications, so I compared the DynamicUniformBuffer approach from earlier with the same approach using a regular malloc. I was going to show this in another graph, but I found no real performance difference between them, so it feels like (at least for this use case), whether to use _aligned_malloc or just malloc is a matter of preference / code portability.
 How i felt when I saw a graph with all the bars the same height
However, while testing this, I realized that (for the Single Buffer Approach), I could reduce the need for this allocation at all with a very small amount of effort. If I could get the mapped pointer to the buffer before I pass this data to the draw function, I could save myself a lot of effort. So I rearranged things a bit to try that out:
//abbreviated code
uniformData = (PrimitiveUniformObject*)malloc(bufferSize);

int idx = 0;
char* uniformChar = (char*)uniformData;

for (const auto& prim : primitives)
{
    PrimitiveUniformObject puo;
    puo.model = VIEW_PROJECTION * (glm::translate(prim.pos) * glm::scale(prim.scale));
    puo.color = prim.col;

    memcpy(&uniformChar[idx * dynamicAlignment], &puo, sizeof(PrimitiveUniformObject));
    idx++;
}

Renderer::draw(uniformData, /* other args */);
Becomes:
//abbreviated code

int idx = 0;

char* uniformChar = Renderer::mapBufferPtr();

for (const auto& prim : primitives)
{
    PrimitiveUniformObject puo;
    puo.model = VIEW_PROJECTION * (glm::translate(prim.pos) * glm::scale(prim.scale));
    puo.color = prim.col;

    memcpy(&uniformChar[idx * dynamicAlignment], &puo, sizeof(PrimitiveUniformObject));
    idx++;
}

Renderer::unmapBufferPtr();

Renderer::draw( /* other args */);
The unmapBufferPtr() call can simply be omitted in order to keep things mapped all the time.
I decided to compare the performance of the Single-Buffer approaches with these changes vs the timing data that I presented last time, and it appears that the above changes yield a modest speed up for all approaches except using push-constants, since they didn’t need the _aligned_alloc call in the first place.
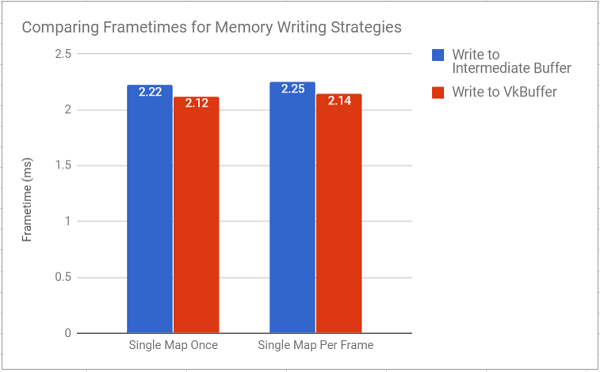
Assuming my methodology for these tests is correct (this is outlined at the end of the post), the data points to at least a small performance improvement from removing that unnecessary memcpy, and cleaner code, since it avoids an unnecessary allocation, and copy.
Use Device-Local Memory
I liked this piece of feedback because it forced me to actually validate an assumption I made in the previous post: that data which gets 100% updated every frame likely doesn’t benefit from being device local. So I’m starting with that as my hypothesis.
For the most part, changing things to use device local memory was surprisingly easy. All it took was changing what buffer was getting mapped when I wanted to transfer uniform data, and then adding code to copy that data (now in a staging buffer) to the device local memory that the shaders ended up using. Given that the nuts and bolts of using a staging buffer are already excellently presented at vulkan-tutorial.com, I’m going to skip talking about that here. You can always check out the repo if you’re curious.
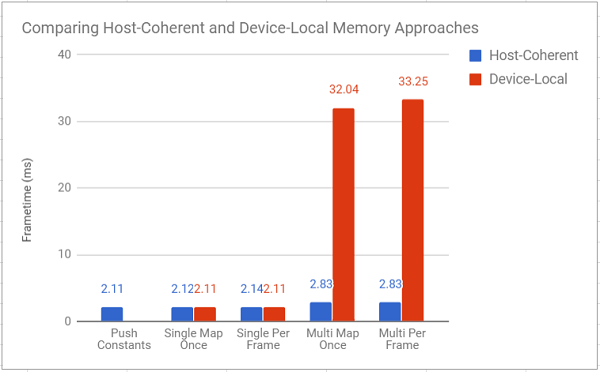
I updated the performance graph from last week with timings using device local memory. I also included timings using vkTimestamps for the draw functions as well (again, only for the loop that created and submitted draw calls, since that’s what changed between different versions).
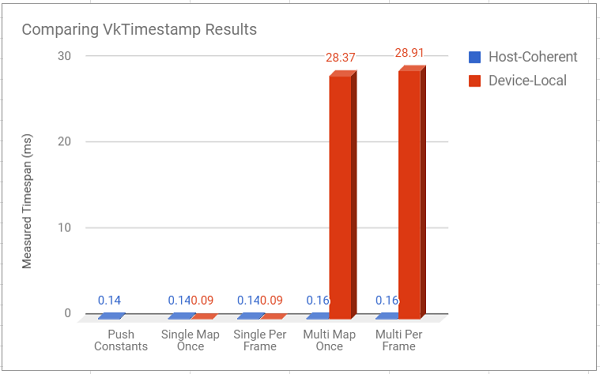 In 3D to show the really small values too
Turns out my hypothesis was wrong. Spectacularly wrong.
The huuuggeee increase in frametime for the multi-buffer versions took me off guard. It’s so high that I’m wondering if I’m not making another weird mistake in my implementation (please, spot my mistake in the renderer.cpp file), but I suppose it does make some sense, given that we’re asking the gpu to do 5000 copy buffer operations every frame in addition to everything else.
That being said, for the single buffer approach, using device-local memory pushed it’s average time per frame to the same speed as using push-constants, which is interesting, but I’m not sure I expect that to hold up given heavier loads (although I’m not sure which one would win in that case). Sounds like something to test in a later (more complex) project.
For now though, the message from this is test is clear: use device-local memory for data which doesn’t get updated frequently (or at least, which doesn’t require a lot of copy buffer operations per frame).
Last note - the two graphs were generated in different runs of testing, so the numbers don’t 100% add up between the two of them, but they’re close enough for me to feel comfortable drawing early conclusions about how to use Vulkan, so I’m not losing any sleep over it.
Re-use Command Buffers
The last bit of advice that I wanted to look into was that I am wasting time recreating command buffers that are mostly identical every frame. The only time the command buffer actually changes is when a brick gets removed. Since all the tests that I’m running involve a static scene anyway, I’m going to work around that here by just having logic move the hit bricks off-screen, instead of removing them. I definitely couldn’t get away with changes like this on a real project, but it works well enough to get some performance data in this case.
I made a few changes to the project so that the actual draw function doesn’t record any commands, it simply submits the pre-recorded command buffers that are generated at the beginning of the project. Unsurprisingly, this is pretty good for performance:
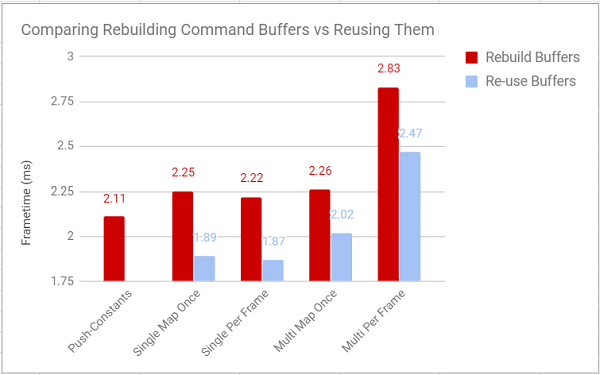 You can't reuse a command buffer with push constants (as far as I know)
From the graph, you can see how much this improves the performance of basically everything. In fact, compared to everything else that I tried, reusing command buffers was by far the single most impactful thing for the performance of the program. It literally made almost everything (except mapping a per object buffer every frame) faster than the push-constant approach, which so far has been the most performant way to do things in every test. I assume that even a less aggressive buffer re-use strategy would pay dividends in a more complex project, and I’m certainly going to be structuring future projects to take advantage of this as much as possible.
I also decided to test to see how these improvements fared when using device-local memory:
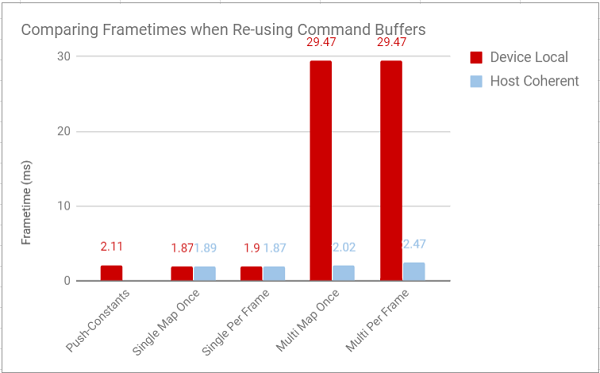
Maybe anticlimactically (since this is my last graph), for the single buffer approaches this did basically nothing. For the multi-buffer approaches, the overhead of doing a vkCmdCopyBuffer for each object every frame still hit performance so hard that reusing the command buffers really didn’t matter. The lesson to gain from all this: pay attention to how often you update a chunk of data before deciding to make it device-local, since that could be doing more harm than good.
I would have taken vulkan timestamp measurements of all of this, but I realized after taking data down the first time that I had changed the first timestamp call to VK_PIPELINE_STAGE_TOP_OF_PIPE_BIT to test something out earlier and had forgotten to change it back, making any timestamp data I got here completely useless for comparing against previous data, and I’m sick to death of this Breakout clone, so I decided to just press on and omit those measurements.
Conclusion
That’s all for today! When I started making my little Breakout clone, I had no idea that it was going to turn out to be so informative! That being said, I need to move on now. There were some bits of advice that I got that I really liked, that I didn’t end up trying out here simply to save my sanity. This code was never written to be anything other than throwaway code, and it’s time to throw it all out and start fresh. Who knows, maybe my next foray into vulkan will even have textures!
If you spot any errors (there’s likely a ton) in the above code, or just want to say hi, I’m always around on Twitter!. I’ve learned more from people pointing out my mistakes in the past week than I did actually building this thing from scratch, so keep the feedback coming!
In case reviewing testing methods is your thing, here's how I got the numbers in all the graphs in this post: